As frequently requested, here is an updated version of a popular post.
The 2016 Admissions brochures for Engineering and other programs have recently been uploaded. We have continued to include a table showing admission probabilities (“chances”) for different programs and grade ranges. It seems that many people find it useful for getting a realistic impression of their chances at admission, so that they can plan accordingly. The online version of this table can be found here. This is based on the 2015 results and as usual we caution that 2016 may be different, since it all depends on the competition level (which is unknown in advance). In 2015 the level of competition continued to increase, but maybe it will go down in 2016, since we know that’s the general direction of the demographics in Ontario.For convenience and readability, we lump the grades into ranges in this table. Some people find the big jumps in probability between the different grade ranges to be difficult to interpret, so I have been generating graphs that provide interpolations between the various grades in finer detail. As usual, the grades shown here are the raw, unadjusted averages of the Grade 12 required courses (or equivalents), not including any other factors such as scores for extracurriculars (the AIF).
For the past couple of years I have used a cubic spline interpolation technique (with linear endpoints), which is one popular method for finding values between sparse data points. I like the results, so I continue to use the same method. As before, I assumed that the probability in the table corresponds to the mid-point of the grade range, and that there is zero probability below 80%, and 100% with an average grade of 100%. As before, I used MathCAD for the number crunching (here is a nice description, for those that might be interested in more details). And below is the result: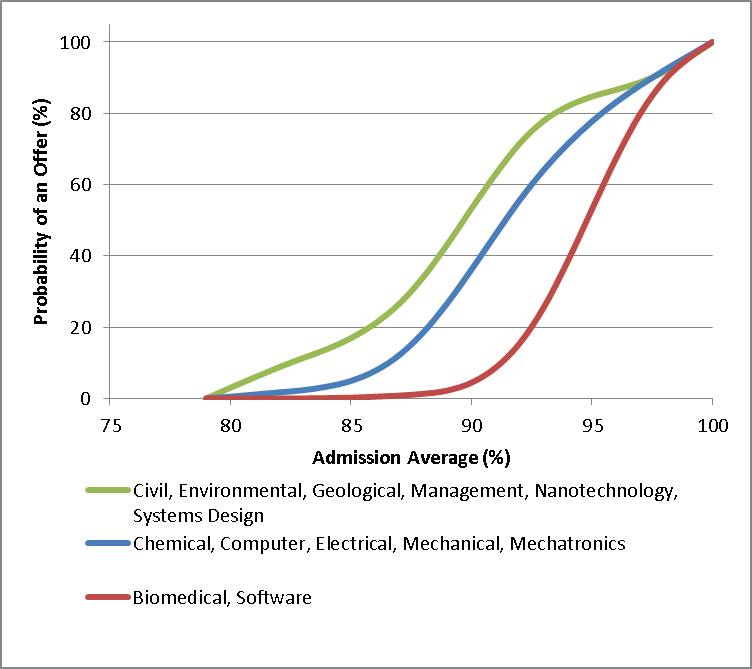
Looking at the results we can make some comments. The green line has a bit of an odd shape towards the upper end (due to the nature of cubic spline interpolation), but is otherwise OK. The blue line looks good. So does the red line, although it is very steep which simply shows the very high level of competition for those two programs.
As usual, these are rough estimates and not guarantees of any sort. It’s possible to have a 99% average and not get admitted if, for example, you don’t submit an AIF or other required document or don’t meet the English language proficiency requirements. It’s also possible that changes in competition levels will move a program from one line to another (either left or right) in the upcoming cycle.
How to Use These Results
If, for example, you expect to have around an 87% admission average and are interested in Software Engineering, go ahead and apply even though your chances appear slim (you might get lucky!). But, on your AIF you can indicate a second and third back-up choice, so a program from the blue line and/or green line would be good. Picking Biomedical as an alternate choice is unlikely to work out well. (Just a reminder that the alternate choices are only considered if you don’t get into the first choice program you applied to.)
As another example, if you are interested and apply to Mechanical Engineering, picking Software and Biomedical as your two alternates is probably not a wise decision. If you don’t get admitted to Mechanical, you will very likely not get admitted to those either.
We always recommend that applicants don’t play games with their choices; stick with ones that you are truly interested in and would be happy accepting. Trying to switch into another program after admission will not be possible in many cases, since they are usually filled to capacity.
Note: if you are comparing this graph with past years you will see that the groupings of programs changes. This is just because of year to year small fluctuations in the level of competition. The groupings are selected to best represent the competition experienced in the past admission cycle.

Is there something for graduate admission? I want to apply but I’m worried my low grade (65% from India) will be a problem. On the website, it says 60% is the minimum marks required for students from India. Can you clarify if I stand any chance in getting admitted?
No, graduate admissions are a completely different issue and set of criteria.
Ah, thanks for answering me. 🙂
Dear Prof,
I have given my A levels with the following subjects: Maths, Further Maths, Physics and Chemistry with the grades ABBB ( Advanced Level) Where do I stand on the graph? I am a permanent resident.
It’s difficult to say precisely, but for many of our programs grades of AAA or better would be necessary for a decent chance.
Hi Prof. Anderson,
I’m a cegep student in quebec (in my 2nd year). I just want to know, when you consider the adjustment factor in the admission score, does that take into account the results of students from my cegep or from my high school?
Thanks!
We look at performance based on the CEGEP, since that’s more relevant.
Hello Professor
I am a grade 11 student who is hoping to apply to the Software Engineering program at Waterloo.
I have noticed that 2 of the 5 required courses for this program are Advanced Functions and Calculus and Vectors.
If I were to take Advanced Functions in semester 1 of Grade 12 and Calculus in semester 2 of grade 12, may I know what mark would be used for my admission average instead of Calculus, considering that the admission process takes place in semester 1? Would it be my Grade 11 Functions mark or would they use my Grade 12 Advanced Functions mark twice?
Also, I have one other question sir. I am currently fast tracking Grade 12 Chemistry and have a 85% at mid term. If I am not able to bring my mark up higher than a 90% by the end of the course, would that hinder my chances of admission by much?
Thank you very much professor
I greatly appreciate your help
Almost everyone takes Advanced Functions in semester 1, then calculus in semester 2, and so we use the Advanced functions grade and double-weight it for the early round of offers. But most offers (70%+) go out in May when we can use the calculus mid-term mark. It’s impossible to predict the effect of a few marks in one course.