The 22nd annual Maclean’s magazine rankings of Canadian universities came out a few weeks ago, and is viewable online. It’s based on overall measures for entire universities, not engineering-specific, so I will only comment on a few points that might be of interest.
This year, Waterloo was ranked #3 overall in the category of “comprehensive” universities (i.e. those with significant Masters and PhD graduate programs/research, but not a medical school). Since some other universities with major engineering programs also have medical schools (e.g. Toronto, Queens, McMaster, Alberta, UBC), it becomes impossible to make any direct comparisons when you’re mostly interested in engineering.
For the 21st consecutive year, Waterloo was named the “most innovative university” in Canada in the reputation survey. It’s hard to disagree with that I guess, considering the number of spin-off companies launched by faculty, staff and students at Waterloo over the past couple of decades.
One other surprising thing I noticed when trying out the Maclean’s rating tool, was that Waterloo spends a lot of their budget on scholarships and bursaries. Apparently more than any other university in Canada, at 16.8%, while many others are in the 7 to 12% range. Interesting, but I’m not sure how to interpret it. The rating tool lets you look at various other statistics, but since they’re not engineering-specific I didn’t spend much time with it.
One thing that did catch my attention was the NSSE results (National Survey of Student Engagement), which is a survey applied across the U.S. and Canada. It is supposed to measure how “engaged” the students are at various institutions. College administrators seem to agonize over these results to discover why their students feel less “engaged” than students at other places. For the Canadian universities, Maclean’s provides a graphical ranking of the results, and on a number of these measures Waterloo seems to come out on the lower end, leading me to wonder why?
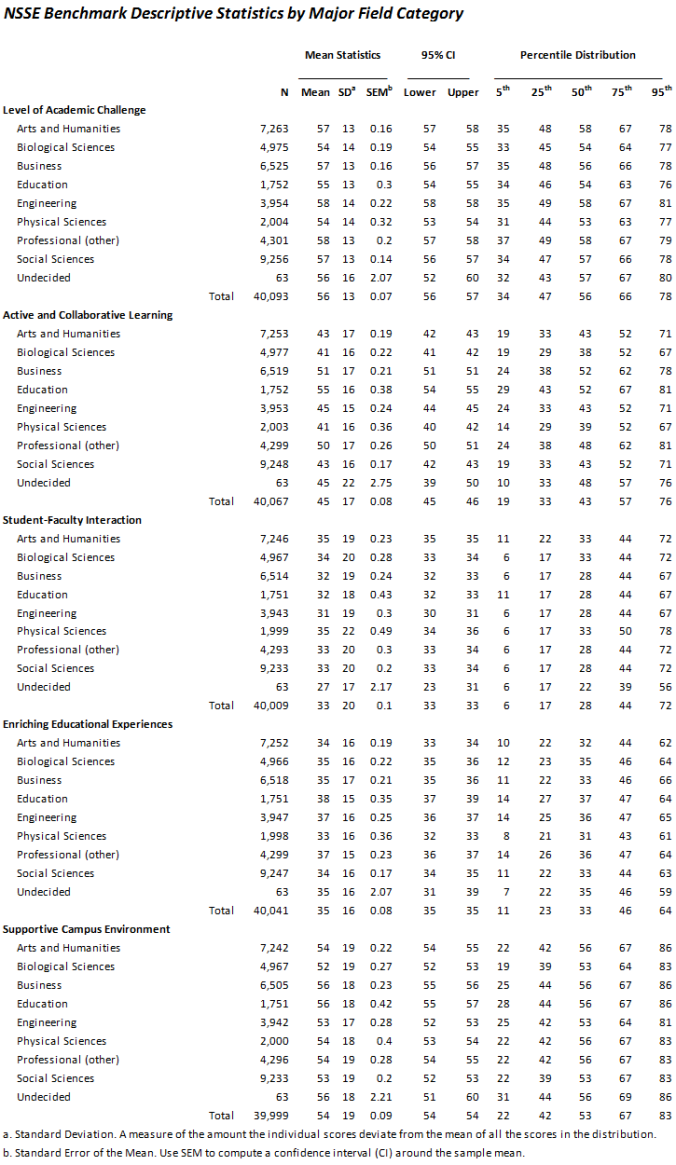
So, I went to the NSSE website, where I found some more useful data that I could look at in more depth. One of the problems with these rankings is that they can easily make an ordered list based on the mean (average) scores for each university, but it tells you nothing about whether the differences in scores are statistically significant (i.e. do they measure true differences, or just some random variations that could change if the survey was repeated). For that, we need to know something about the “standard deviation” of scores, and that’s what I got from the NSSE website, reproduced below for all Canadian universities combined, for senior level students.
UPDATE
I found some additional data on sample sizes at Waterloo (another critical piece of information when testing statistical significance). After a bit of further analysis, it seems some of the differences between universities in the Maclean’s graphic are likely significant. It’s a lot of effort to work through all the data for every university however. For those interested in Waterloo’s results, they are available here.
One thing to remember when looking at these surveys: they tend to reflect how the students feel about their experience versus their expectations of what could or should have happened. They are not really an objective comparison of universities, because few students have attended more than one.
